Data-driven Support Management
BY JACOB FIRUTA & PIOTR BEDNAREK
Turning data into satisfaction
There’s no room for guesswork in a successful customer service department. You want to track everything that will help you build faster and more efficient customer support team. We can help with that.
This ebook will show you how to:
- get your customer service data,
- see how efficient your agents are,
- tell how are particular types of cases handled,
- filter spam and empty chats from your statistics,
- know how many agents you need to cover all chats.
After reading this ebook, you will know exactly what data to track at the end of each week to improve your team’s efficiency and your customers’ satisfaction. In other words, you will be able to make decisions and manage the customer service team based on the data provided by LiveChat.
Piotr Bednarek
Head of Customer Support at LiveChat, managing a team of 13 agents. Through data-backed decisions, Piotr managed to tackle the increasing number of chats LiveChat gets (20k monthly) while increasing customer satisfaction to 97%.
Jacob Firuta
Customer Success Manager who makes sure that customers have all the necessary tools and knowledge to create good customer service. You can check his latest articles on the LiveChat Blog and in the Resources section
Data
To start off, you need the data from your LiveChat. Use the Export option in your Reports section to get it. Don’t have that in your LiveChat? Start a chat with us and we’ll get you sorted with a free 7 day trial of our reporting module from the Enterprise plan.
When you open the Export page, there are a couple of options available:
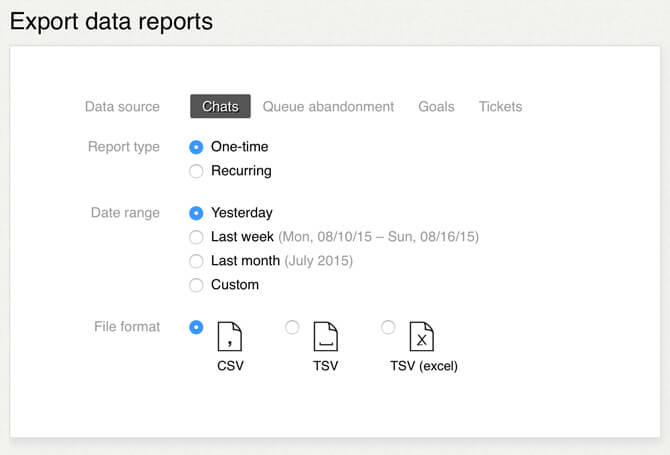
- Data source: Choose what kind of data will be pulled from LiveChat. In this ebook, we will discuss chat data, but you can also export information about queues and goals.
- Report type: You can choose if you want to receive a one time report or one that will be sent to you automatically every few days, weeks or months.
- Data range/Report frequency: Select the time period that should be available in the report or how often you want to receive it.
- File format: Pick the format you are used to in your calculations.
For the purpose of this ebook, we will go with a CSV report on Chats from last week. After you make your selection, enter your email and click on the Email report button.
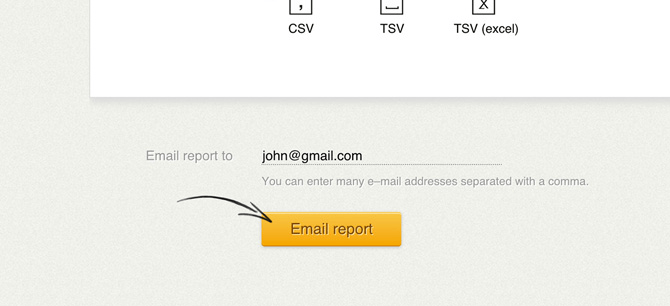
The report should arrive in your inbox in a moment. It will contain all the chat information from the past week. Depending on the traffic you get, it can get pretty big. Don’t get scared after you open the file, it will be much clearer in a moment.
We’ve prepared a little Excel spreadsheet that will calculate a few important metrics for you. Download the spreadsheet before continuing further.
Here’s the list of metrics it calculates using the report you just pulled:
- The number of chats you got.
- How many visitors proceeded from queue to chat.
- Chat duration.
- Percentage use of various chat tags.
- Customer satisfaction.
If you put the report data into the spreadsheet, it will calculate the values for you. To import your data, open Excel and go to the Data tab.

Next, select Text and choose the report file.
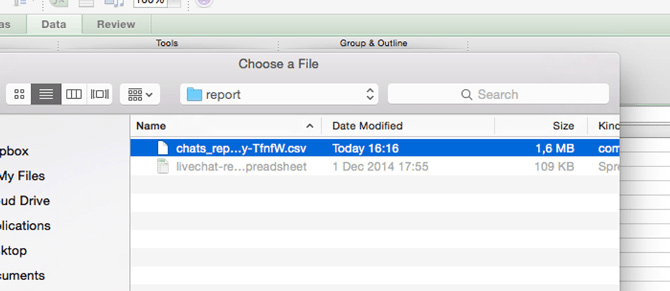
Pick the Delimited option and click on the Next > button to proceed.
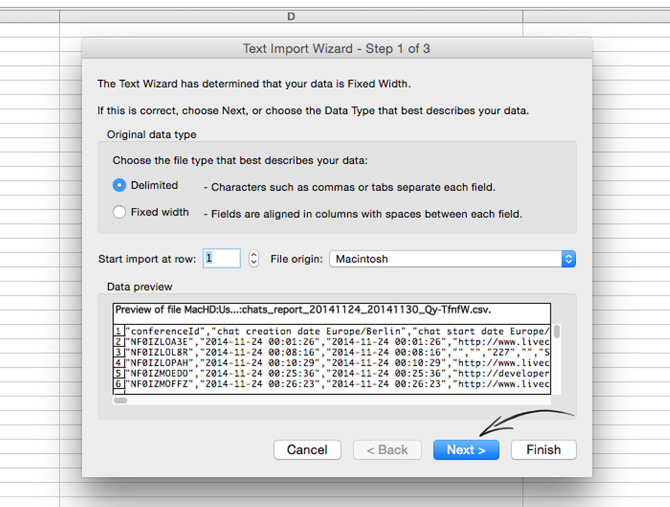
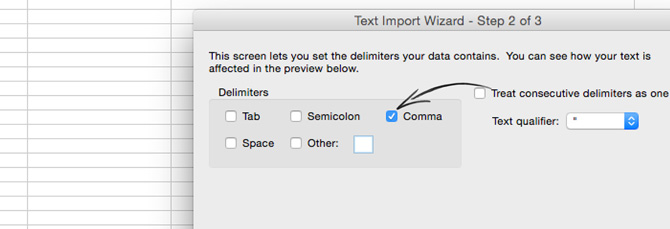
Change the Delimiters option from Tab to Comma. Select Next >.
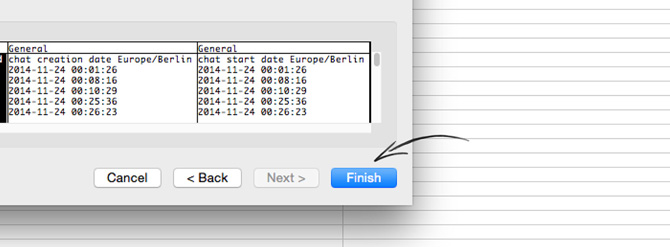
Click on the Finish button.
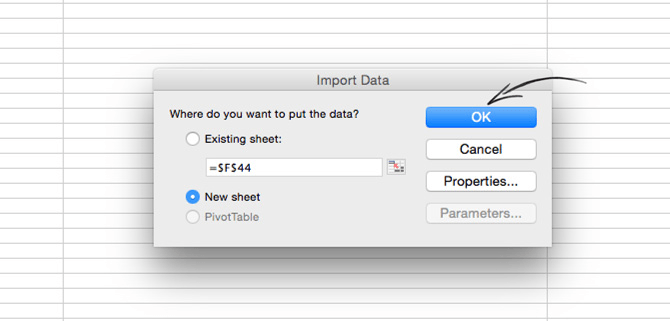
You will be asked where you want to place the data. Choose the New sheet option and click on the OK button.
The data will be placed in Sheet1. Select everything from the sheet (Ctrl+A on Windows or Cmd+A on Mac) and copy it to the Data tab. The formulas will calculate all the values automatically.

Some of the tag-specific values won’t show up immediately, unless you already tag your chats with those specific tags. Feel free to adjust the formulas to reflect the tags you are currently using. You can do that by changing the name of the tag in the Variable 1 column.
When pulling this report regularly (for example, at the end of each week), you can see how the metrics change over time and what kind of trends appear.
In the next part, I will show you why we picked this particular metrics and what kind of methodology we applied.
Metrics
When choosing the most important customer service metrics, we focused on three things: the demand your LiveChat is getting, how efficient it is and what kind of results you get.
If possible, both median and average is available. Even though the average can give you pretty good idea about a particular metric, the median is more precise by getting rid of the extreme values that skew the analysis. For example, if you get 1 chat a day for six days and then 100 chats on the seventh day, the average will be much higher than the median.
Here’s a breakdown of the three categories.
This category shows you how many people want to contact you through LiveChat and if you are able to fulfill that request by having enough people online.
The number of chats you get shows you how many customers managed to contact you. The number of people that entered queue shows how many of them had to wait before chatting.
If the number of queued visitors stays relatively low when compared to the number of chats, your customer service is in a good place. In a perfect situation, you don’t want any visitors in the queue, while keeping your agents occupied at all times. This will require you to get more agents to handle the additional chats.
It is possible to answer the demand by handling more chats at the same time, but it’s very risky and requires a lot of training.
We found out that 100 chats a day per agent (who can have up to 6 chats at a time during an 8-hour shift) is the tipping point where it is a good idea to consider hiring another person. Bear in mind that we don’t want anyone to land in the queue, as this can lead to bad experience. This gives you around 400-500 chats per agent during a 40-hour work week.
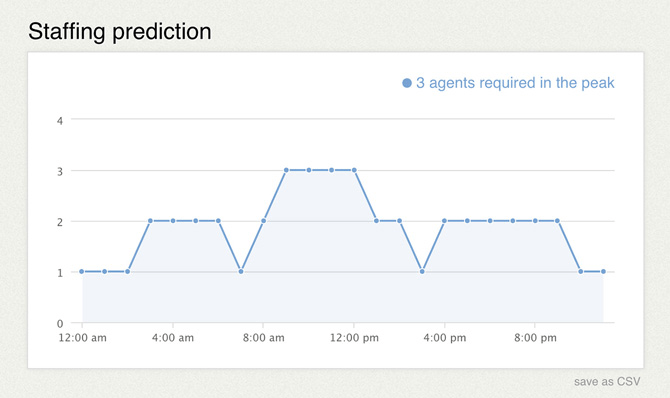
You can also use the staffing prediction report to get more information about your staffing needs. It will estimate when you will have to get another agent to handle the overflowing chats.
You can track how efficient your customer service is by measuring how much time it takes for an agent to finish a chat.
You can aim to bump this metric lower and lower. However, there comes a point where rushing through a chat will make the customer’s experience worse. Keep also in mind that not all cases are the same and some may take more time to handle than others.
For us, the average sits around 13 minutes, with a much lower median of 4 minutes and 30 seconds. These two values show how much longer some chats take. Check the benchmark page to see how long it should take to resolve a case in your industry.
You can compare the average and median values with average handle time data for each agent separately by going to the Chat duration report and selecting a particular agent using the filtering options.
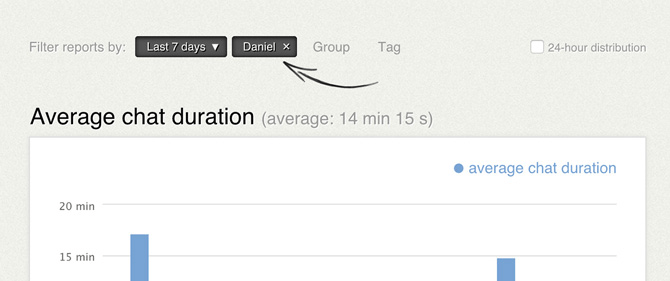
The most important metric – customer satisfaction – will show you whether customers are satisfied with the service provided via chat or not. The metric takes all good and bad rates into account and gives you a single, percentage value. You should keep this value over 87 percent – the global benchmark for customer satisfaction.
You can check how high the customer service is in various industries on our Benchmark page, which offers the latest customer service data from 24 major industries.
It’s also worth keeping track of how many of your chats is rated by customers.
These basic metrics will make for a good indicators of the state of your customer service. But remember that they may include a lot of noise too. For example, our customer service is rated at 87 percent. But if we get rid of the rates from empty and spam chats, it goes up to 97 percent.
To get precise information like that, you will need to brake the data down into smaller chunks for separate cases. See how to do that in the next part.
Segmentation
To get more in-depth information about your customer service, you can segment the data you get from LiveChat by using tags. By tagging as many chats as possible, you will be able to tell how are particular cases handled.
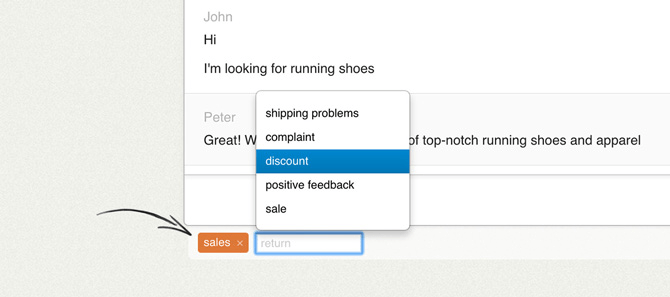
You can start off with a simple division on support and sales cases. You can use the aforementioned spreadsheet to calculate the demand, efficiency and effect of your customer service for sales and support chats.
This information is valuable for those two departments, as it will suggest what changes can be made to optimize the way the departments operate.
You can also use tags to mark irrelevant chats. For example, you can exclude chats that are empty, i.e. the visitor started the chat but went silent after saying “Hi.” Rates from such chats shouldn’t be treated the same as rates from a normal conversation and you can ignore them in your calculations.
Feel free to also exclude spam chats where someone is maliciously trying to interrupt your work.
Apart from the different customer satisfaction values I’ve mentioned, you can also check how long it takes to finish a chat in different cases. In our case, support chats are nearly two times longer than the average, while spam and empty chats nearly two times shorter. The median for the empty chats is only one minute, which shows how little they contribute to your customer satisfaction score.
To make the segmentation work, you should mark most, if not all, of your chats. The spreadsheet keeps track of how many of your chats were tagged. We worked our way from having 75 percent of our chats tagged to tagging 93 to 95 percent of our chats.
Getting all chats tagged requires some discipline, but it’s definitely worth it. Here’s all the extra information you can get by tagging your chats:
- How many sales / support / spam / empty chats you get.
- How long are your sales / support / spam / empty chats.
- Customer satisfaction for sales / support chats.
Whenever you make a change in your customer service structure, you will be able to notice how it affected particular metrics.
Advanced Metrics
When you get a grasp of the basic metrics from the spreadsheet, you can start digging deeper in your data for more insights.
Here are three reports we use in the assessments of our customer service:
1. Chats / hours: Dividing the weekly number of your chats by the sum of all working hours of your agents will show you how many chats per hour agents get. We use 7shifts to calculate the total number of hours our agents spend on chatting.
Weekly number of chats
sum of all working hours
At the moment, we are getting around 12-15 chats an hour. We plan to hire another agent when we start hitting the 15 chats per hour mark consistently.
2. Useful chats: Use this metric to see what portion of your chats is valuable. Get it by multiplying the total weekly number of your chats by the percentage of your sales chats, support chats and any other valuable cases you track.
Weekly number of chats
×(percentage of sales chats
+percentage of support chats
+… )
This metric will show you how much of your agents’ work is spent on productive chats. When coupled with Goals, you can see how many of your valuable chats ends up with a sale or a signup.
3. Time spent on empty chats: You can see how much of your agents’ time is taken by the empty chats by multiplying the weekly number of chats by the percentage of empty chats and the median time for empty chats.
Weekly number of chats
×percentage of empty chats
×median chat length of an empty chat
When tracking this value, you will be able to see how much down-time your agents get between valuable chats. When you notice that this number keeps going up, you should increase the number of concurrent chats your agents are getting or give them an additional task.
Another advanced use of this data is measuring various trends for longer periods of time. By storing these metrics on a weekly or monthly basis, you will be able to see how is your customer service improving.
You can use Excel’s conditional formatting to get information whether the value goes up, down or stays the same. Do this by selecting the data from various weeks and picking one of the conditional formatting options, e.g. directional sets of icons.

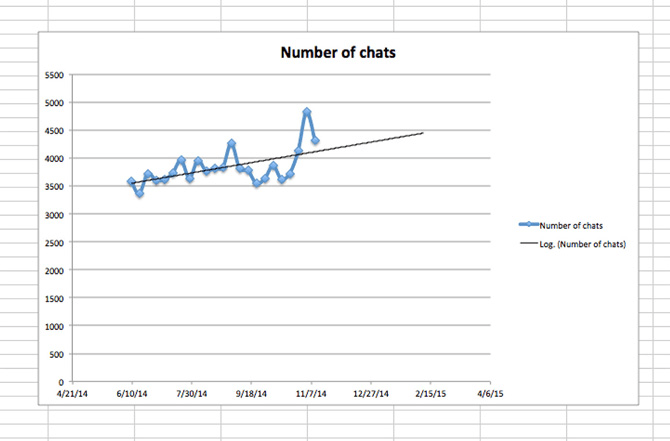
It is also possible to draw a chart showing the trend in a more precise manner. You can use the livechat-spreadsheet chart to see how is the gains and losses in your customer service metrics.
To do that, you need to save the data for each week in separate columns and then draw a trend chart for them. Here’s a short tutorial on how to use that type of chart.
Test the Reports
Tracking customer service metrics will show you how your actions and decisions affect the satisfaction of your customers. You no longer will have to guess what to improve or how is your team doing.
Give the reports a try and see if you can beat the global average or your industry’s average customer satisfaction score.
If your LiveChat doesn’t have these reports, start a chat with us and we will give you a free, 7-day trial of our reporting module.
It’s time to stop guessing and start knowing.
If you like the ebook, share it on your social media!